

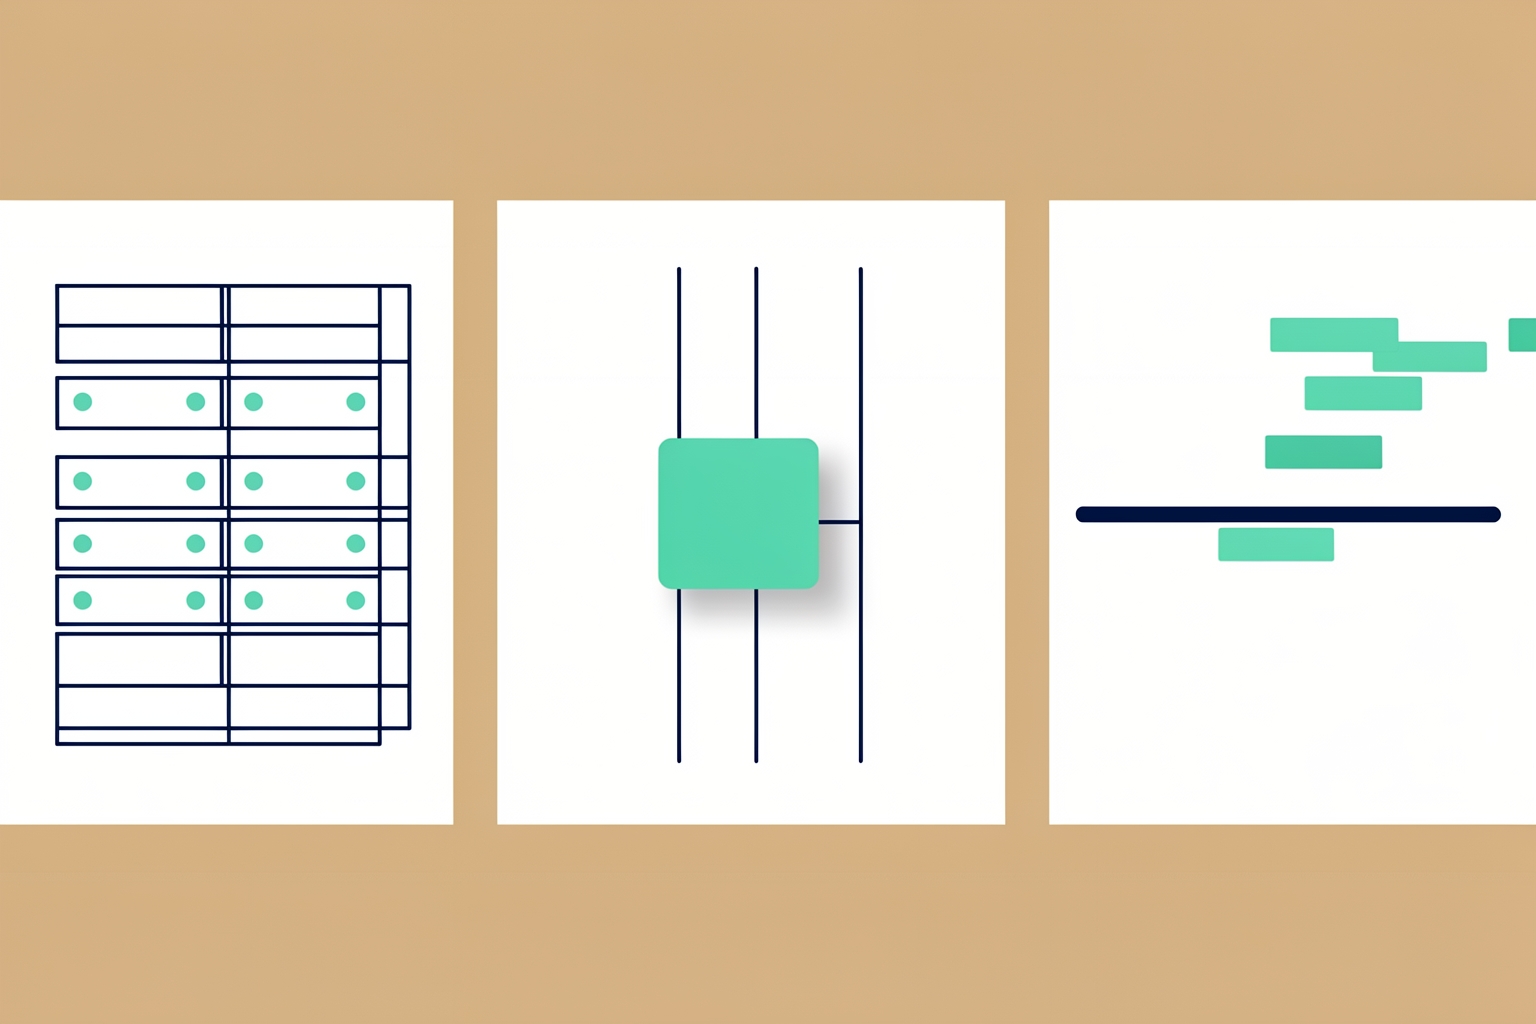
What the three layouts have in common
GitHub Projects gives you three ways to look at the same work: a table, a board and a roadmap.
The items, fields and filters stay the same.
Only the shape of the view changes.
Picking the right shape for each situation saves you from rebuilding your project every few weeks.
This guide explains what each layout does, when it fits, and how to switch between them.
Every layout fact here comes from GitHub's official documentation on changing and customizing project views.
All three layouts show the same underlying items: your issues, pull requests and draft issues, together with GitHub metadata and any custom fields you have added to the project.
You are not choosing between three separate tools.
You are choosing how to present one dataset.
You can set each view in your project to a different layout.
Open the view, click View next to the search bar, and under Layout choose Table, Board or Roadmap.
Because views are separate, you can keep a table view for planning, a board view for daily work and a roadmap view for deadlines, all inside one project.
The table layout: a spreadsheet for your work
The table layout is a high-density spreadsheet built from your items and fields.
GitHub describes it as powerful and adaptable, and the customization options back that up.
You can group, sort and filter items, show or hide fields, reorder rows and columns, and slice items by a field value in a side panel.
Two table behaviors are worth knowing before you start dragging things around.
First, when items are grouped, dragging an item into a new group applies that group's value to the item.
If you group by Status and drag an item marked In progress into the Done group, its status switches to Done.
Second, you cannot group or slice by title, labels, reviewers or linked pull requests, so plan your custom fields around the ways you actually want to organize work.
The table also supports field sums.
If you track estimated hours in a number field, you can display the sum of those hours per group, which turns the table into a lightweight capacity view.
When the table fits best
Choose the table when you need to see many fields at once and make decisions across the whole backlog.
Typical situations:
- Triage: sorting a mixed list of ideas, bugs and requests by priority and effort.
- Planning: grouping by assignee or iteration to balance workload.
- Review: filtering to a subset, such as everything tagged for one client, and scanning details inline.
The tradeoff is density.
A table shows a lot at once but gives you little sense of flow or timing.
If your main question is what happens next, another layout will answer it faster.
The board layout: columns for flow
The board layout spreads your items across customizable columns.
You pick any single select or iteration field as the column field.
Using a Status field gives you a classic kanban board, but you can also build columns from a priority field, a team field or an iteration field.
Dragging is the core interaction.
Move an item from one column to another and its value updates to match.
Drag several items at once when you are batch-updating.
You can also show or hide columns, group items into horizontal sections, and slice by a field value.
One board-specific feature is the column limit.
You can set a maximum number of cards for a column.
GitHub is explicit about what a limit does and does not do.
It does not restrict anyone, or any automation, from adding cards beyond the limit.
The current count and the limit appear at the top of the column and are highlighted when the count exceeds the limit.
In practice, a limit is a signal, not a gate.
Use it to make visible when a column, such as In review, has accumulated more work than the team can process.
There is one sorting caveat.
When a board is sorted, you cannot manually reorder items within a column.
You can still move items between columns, but if precise card order inside a column matters to you, leave the board unsorted.
When the board fits best
Choose the board when your main question is where each piece of work stands right now.
It fits daily standups, personal task tracking and any process with clear stages.
The tradeoff is that a board shows one field as columns.
If you need to compare five attributes per item, you will keep switching back to the table.
The roadmap layout: work on a timeline
The roadmap layout gives a high-level visualization of your project across a configurable timespan.
It positions your issues, pull requests and draft issues on a timeline using your custom date and iteration fields.
You can drag items to change their start and target dates or their selected iteration.
The roadmap also supports vertical marker lines to highlight key dates, including iterations, milestones and the dates of items in your project.
GitHub notes these markers help you see your upcoming workload and how it is distributed across iterations or milestones.
The practical prerequisite is easy to miss: a roadmap is only as good as your date and iteration data.
If items have no dates or iterations, there is nothing to position.
Before adopting a roadmap view, make sure the fields it depends on are actually filled in.
When the roadmap fits best
Choose the roadmap when your main question is when work happens and whether it fits the time you have.
It suits launch planning, quarterly overviews and any conversation with stakeholders who care about dates rather than card statuses.
The tradeoff is detail.
A timeline shows sequencing and timing well but hides the field-level detail a table exposes.
A quick decision check
Ask one question about the decision you are trying to make this week:
- Am I comparing and organizing many items across several attributes? Use the table.
- Am I moving work through stages day to day? Use the board.
- Am I planning timing, deadlines or capacity over weeks and months? Use the roadmap.
Because layouts attach to views, you do not have to pick just one.
A common pattern is a table view for triage, a board view for active work and a roadmap view for planning conversations, all pointing at the same project.
Setting up your first views
A simple starting configuration, using only documented features:
- Create one project and add your issues, pull requests or draft issues to it.
- Add the custom fields you will actually organize by, such as a Status single select field, a Priority single select field and a date or iteration field if you plan timelines.
- Set your first view to Table. Group by Status or Priority and confirm the grouping matches how you think about the work.
- Add a second view and set it to Board with Status as the column field. Set a column limit on any stage that tends to pile up, remembering the limit signals overload rather than blocking cards.
- If your dates are reliable, add a third view set to Roadmap and use it for planning reviews.
Keep field names plain.
A Status field with values like To do, In progress and Done beats clever labels.
The same field drives table grouping, board columns and roadmap iterations.
Common mistakes to avoid
Treating a column limit as enforcement is the most frequent board mistake.
The limit highlights an overloaded column; it does not stop cards from being added, so someone still needs to act on the signal.
Building a roadmap before dates exist is the most frequent roadmap mistake.
Fill in start and target dates or iterations first, then the timeline becomes useful.
Trying to group a table by labels or reviewers is a common table mistake.
GitHub does not support grouping or slicing by title, labels, reviewers or linked pull requests.
If those distinctions matter, capture them in a custom field instead.
How this fits a small project
If you are validating an idea rather than running a team, start with a single table view.
It is the lowest-effort way to see everything you have committed to.
Add a board only when you have real work in motion through stages, and a roadmap only when dates become part of your decisions.
Growing your views with your project keeps setup time low and avoids maintaining empty structure.
For a broader look at choosing what to work on in the first place, see our guide on choosing the right small project before you commit.
If you are still deciding where ideas should live before they become project items, the comparison of GitHub Discussions vs Issues for early ideas covers that decision.
And once a project is real enough to need light planning documents, project poster vs project charter explains which one fits.
Key takeaways
- Table, board and roadmap are three views of the same project data, and each view can use a different layout.
- Tables excel at multi-attribute organization; boards at stage-by-stage flow; roadmaps at timing and workload over a configurable timespan.
- Board column limits signal overload but do not block cards, and sorted boards prevent manual reordering within columns.
- Roadmaps depend on filled-in date and iteration fields, and tables cannot group or slice by title, labels, reviewers or linked pull requests.
Start with the layout that answers this week's real question, and let the other views earn their place as your project grows.
Source references: docs.github.com; docs.github.com; docs.github.com.
Take the next step with Ideoreto. Use the ideas in this guide as a starting point for your next project.
Register for Ideoreto to get started.